A Cost Analysis of Media Consumption using System Dynamics Modeling in a Data Storage Backup Environment
An analysis of Tape, Virtual Tape Libraries (VTLs), Disk Storage Units (DSUs) and deduplication repositories as backup target mediums in enterprise backup environments when considering disk as an alternative to tape.

Presented in part in the 2007 Proceedings of the Storage Decisions Conferences in Chicago, Toronto, New York & San Francisco.
© Brian J. Greenberg. All rights reserved.
To provide feedback on this white paper, please send e-mail to [email protected].
The information contained in this document represents the current view of the author on the issues discussed as of the date of publication. Because the author must respond to changing market conditions, it should not be interpreted to be a commitment on the part of the author, and the author cannot guarantee the accuracy of any information presented after the date of publication. This White Paper is for informational purposes only. THE AUTHOR MAKES NO WARRANTIES, EXPRESS OR IMPLIED, IN THIS DOCUMENT. Other product or company names mentioned herein may be the trademarks of their respective owners.
Abstract
Using computer tape for data storage has a long and established history going back to the early 1950’s. Today there are newer, heavily marketed and overly hyped disk storage technologies and even more advanced tape technology for the consumer to consider. Among these technologies are disk targets such as multi-tier virtual tape libraries and disk storage units. Additionally, there are MAID (massive array of idle disks), deduplication and single instance storage options. Assessing the options available and trying to figure out the costs of replacing tape with disk is not a simple one. Exploring the myriad of technologies, storage architectures and operational criteria such as performance, risk assessment, RTO (recovery time objective) and RPO (recovery point objectives) as well as the businesses data protection policies and legal requirements can bewilder even the most seasoned professionals. Particularly difficult is calculating the costs of these storage architectures which requires an understanding of data growth, storage density and calculating media consumption in a backup system with variable schedules, backup levels, data and media growth rates as well as activities involving data migration and moving media to an off-site location.
In this paper, I present a unique approach to predict and model media consumption within production backup environments in various industries using either disk or tape as a backup target. The configurations and architectures of backup environments analyzed was done for the first time utilizing system dynamics modeling. By developing these models I was able to run backup system simulations over a span of years that provided data on media consumption for both disk and tape. I was also able to incorporate leveraging technologies such as deduplication or single instance storage into the models to analyze the correlating cost differences potentially affecting the total cost of ownership for each architecture.
Introduction
The tremendous advances in low-cost, high-capacity, high-speed magnetic tape storage have been among the key factors helping establish a ubiquitous foothold of tape storage in nearly every company throughout the modern world. Advances in low-cost, high-capacity magnetic disk drives have also contributed greatly in competing with tape as a storage alternative, most commonly in the form of Virtual Tape Libraries (VTLs)
This paper will help business leaders, storage administrators and storage architects understand the current and future landscape of backup target technologies, how to calculate costs associated with these technologies and help them decide which offerings are most suitable for their needs.
The use of tape backup varies widely between enterprises where some will maintain quantities of tapes in the hundreds to the hundreds of thousands for both backup and archive purposes. Contrary to common opinion, having a lot of tapes in of it self is not necessarily a bad thing since the media management of most backup applications tends to do that job that quite well. The purpose of this paper is not to discuss any of the myriad of other topics that fester throughout the industry as arguments for using disk or tape to back up an organizations critical data. I will not be examining performance in this paper either for the simple fact that in many real world tests and applications, 90% of the time I performed backup to tape or disk, tape write speeds were generally faster than I was able to read data from the disk wether that data be DAS attached or SAN or NAS attached utilizing either SCSI, FC or iSCSI protocols. The focus of this paper is the application of system dynamics modeling and simulation to media consumption in a backup environment reflecting the costs associated with using disk or tape as a backup target medium.
System Dynamics Modeling & Simulation
System Dynamics is a methodology for studying and managing complex feedback systems, such as one finds in business, scientific and social systems. In fact it has been used to address practically every sort of system where feedback mechanisms could be identified or inferred. While the word system has been applied to all sorts of situations, feedback is the differentiating descriptor here. Feedback refers to the situation of X affecting Y and Y in turn affecting X perhaps through a chain of causes and effects. One cannot study the link between X and Y and, independently, the link between Y and X and predict how the system will behave. Only the study of the whole system as a feedback system will lead to correct results. The methodology:
- identify a problem
- develop a dynamic hypothesis explaining the cause of the problem
- build a computer simulation model of the system at the root of the problem
- test the model to be certain that it reproduces the behavior seen in the real world
- devise and test in the model alternative policies that alleviate the problem
- implements the solution
Rarely is one able to proceed through these steps without reviewing and refining an earlier step. For instance, the first problem identified may be only a symptom of a still greater problem. The field developed initially from the work of Jay W. Forrester. His seminal book Industrial Dynamics (Forrester 1961) is still a significant statement of philosophy and methodology in the field. Since its publication, the span of applications has grown extensively and now encompasses work in:
- corporate planning and policy design
- public management and policy
- biological and medical modeling
- energy and the environment
- theory development in the natural and social sciences
- dynamic decision making
- complex nonlinear dynamics
Source: System Dynamics Society, http://www.systemdynamics.org

For the purposes of this inquiry, I employed system dynamics modeling software from isee Systems called iThink/STELLA. All the following model representations and graphs are produced straight from iThink.
The Model
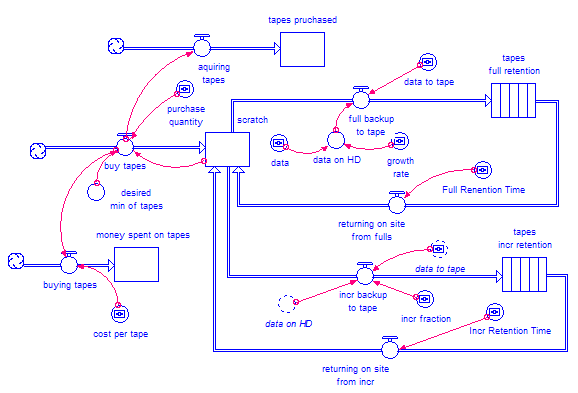
 The illustration to the right is a model for tape based backup system. The model consists of a single backup policy that can viewed as an average behavior pattern of an environment or that of a single backup policy that includes full backups and incremental backups. The model contains feedback loops in regards to the behavior that occurs during the process of backing up data in a typical commercial backup application such as Veritas/Symantec NetBackup or EMC NetWorker. This particular model provides the ability to dictate; how frequently backups occur, either full or incremental, the retention period of data on tape for each level of backup, the data growth rate, the incremental difference rate, cost of media, thresholds for purchasing media and other such real-world variables that occur in a typical backup engineering and operations organization. There are some assumptions that this model takes into account such as sending media off-site every day to satisfy common corporate policies to off-site media for disaster recovery purposes.
For the purposes of this paper I will demonstrate a backup system simulation over a period of five years, or 1,825 days of backing up 150TB of data both to tape and to disk (VTL/DSU) using all the identical configuration policies in order to show a direct comparison of costs over time. These costs will be limited only to the media (tape/disk) required to store the data. No infrastructure costs will be explicitly considered for the purposes of this paper, however, it will be apparent by the end what additional costs there will be in terms of data center space, replication costs, HVAC, bandwidth, etc.
The simulation begins with a green field environment with no backed up data to start with, 150TB of data on disk with a 10% growth rate and a 10% rate of change on a daily basis. We will conduct weekly full backups and daily incremental backups. We will retain the full backups for 3 years as a typical average length of time for many organizations. Many organizations will retain backup data for upwards of 20 years to satisfy regulatory issues. One thing to note, I am not drawing a difference between backup and archive. Most organizations use their backup as archive, correctly or not, this is a fact and considered in the construction of this model. We will also retain the incremental backups for 30 days. Once all the backup data has expired (reached the end of retention), the media will be returned into the backup scratch pool to be reused. When a minimum threshold of media remains in the scratch pool to conduct backups, new media will be purchased. In the case of this model, we will be using LTO-3 tape technology at an average cost of $50 per tape. We will also have an average compression rate of the LTO-3 tapes at 500GB per tape, where the native capacity is 400GB and a 2:1 compression rate at 800GB, but for the purposes of this model we will give it a 25% compression rate as an average. All relative parameters for the tape as a target backup model will be directly applied to the disk as a target model. The only differences will be the compression rate which we will explore as deduplication ratio and the cost of disk per GB.

One of the beneficial features of this model is that we have the ability to make a single change in one place, such as with the retention time of a full backup or the rate of change of data on disk and it will be replicated in each of the two models relating to tape and disk for each fundamental component of the feedback loops are linked in order to give us directly correlated results.
The model to the left is the same model as above however, it is adjusted only in the way required as to account for using disk as a backup target instead of tape and to optionally use deduplication as opposed to tape compression. In the diagrams of the models, each of the circles (called converters) that are drawn with dotted lines are linked to each other. This means, when I change the retention time in the tape consumption model above, the direct change happens to the retention time in the disk consumption to the left.
With tape usage, when a backup image expires from media the tape is returned to the backup scratch pool for reuse. With disk, when a backup image expires from disk, the image is erased from disk and the disk space freed up for use for more backups.
What follows below is a graph of tape usage over a five year (1,825 day) simulation. The red line (1) indicates the number of tapes that are being used with images that are under the full, three year retention level. The green line (3) indicates the number of tapes that are being used for images that are under the incremental, 30 day level. The purple (2) line indicates every time we reach the threshold and need to buy tapes. In this case the quantity of tape purchases are in increments of 1,000 and the minimum threshold is 300 tapes. This would allow for a period of time in which to order tapes and have them shipped while still being able to perform backups without missing a backup window due to a lack of media.
Notice what happens at the three year (1,095 days) mark, the behavior of purchases and media on full retention change. At three years, media that had images on them start to return to the scratch pool and are able to be reused, thereby reducing the frequency of purchasing more tapes from roughly every 15 days to roughly every 60 days. Tapes on incremental retention reach their upper limit early and remain fairly constant after the 30 day retention level and only increase in direct correlation to the data growth rate over time which in this model is 10% which effects both incremental and full backups equally.

At the end of our five year simulation, we can quantify how many tapes we have purchased and at what cost. In this model 68,000 tapes were purchased over the span of 5 years at a cost of $3.4M, assuming that the cost of media remains constant. Since we know that media costs do reduce over time, we can adjust that price over time based on historical trends in a slightly more complex model and provide similar correlations for the cost of disk as a backup target. However, for the purposes of this model, we are assuming a fixed cost of media over the five years. We can almost be certain that the cost of media will not increase per GB for either tape or disk so our $3.4M figure is assumed high for our media consumption cost model.
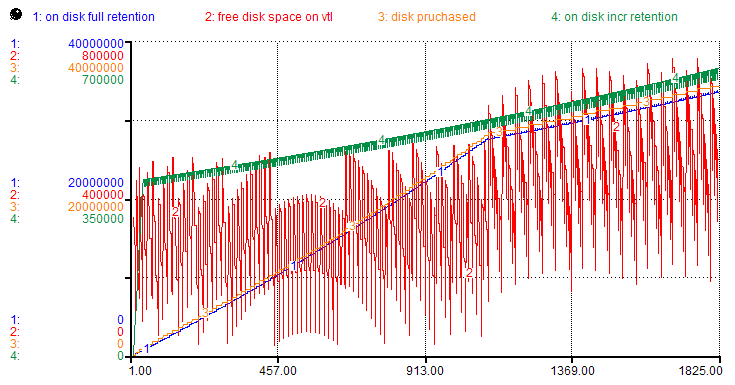
Taking the exact same model and graphing media consumption for disk, we get the graph shown below. The blue line (1) is how much data is stored on disk at our full, three year retention. The green line (4) is the data on disk at our incremental level. The orange line (3) is the amount in GB of disk purchased and the red line (2) is the trend of free space on our disk storage device or VTL/DSU. As you can see, the data on disk at full retention levels and the data on disk at incremental levels expectedly behave the same as they do on tape.

The pattern and quantity of disk purchased directly follows the amount of data backed up to disk. After our five year simulation we can see how much disk we purchased for the exact same backup policies that we used for tape. In this same model, we assumed the cost for disk was $3/GB which is quite low. We have seen an average price at the time of this writing closer to $5 or $6 per GB but we took into account heavily discounted enterprise pricing. The low water mark threshold of purchasing disk was the amount of data on disk to be backed up and to purchase in quantities of 350TB increments.
Please note that at no time in this model do we assume costs for replication nor the infrastructure to support replication of either tape or disk based backup target architectures. However, you can easily consider that you would have to double costs for disk and add costs for increased bandwidth capacity to satisfy the off-site or duplicated data copy requirement. For tape, it's a much simpler calculation with only an increase in media costs if you need to create two copies. The act of off-siting your media alone may satisfy your companies data protection policies. These requirements will vary from organization to organization. However, you are likely to incur two to three times the cost for disk based architectures rather than tape only architectures just to address the requirements of off-site copies of data. Discussion regarding comparable architectures and the implications to each are not covered in this paper but may be in follow up discussions. Here we are focusing on the single, primary backup copy, regardless of where it's kept. It will be easy for you to do the math following the initial analysis of media consumption within our model. At a purchase price of $3/GB of disk over the span of five years 34.3PB or 35,123.2TB of disk would be purchased with a total cost of $102.9M.
Compare the heavily discounted cost of $3/GB for disk to the average price of 10¢ to 13¢ per GB for tape. Or in the case of our simulation and model, $102.9M for a disk architecture and $3.4M for a tape architecture. With a difference of more than 30x the cost for disk than tape, one needs to step back and consider if they really want to jump into the world of disk based backup without considering ways to lower the total cost of ownership. The fundamental cost in the average enterprise is the retention of data that is backed up. With altering the retention level of data backed up, we can effect an impact on the TCO. Below we can see that only changing the retention level of full backups to 90 days from three years can have a profound impact.

Graph of disk based backup with 90 day full retention rate.

Graph of tape based backup with 90 day full retention rate.
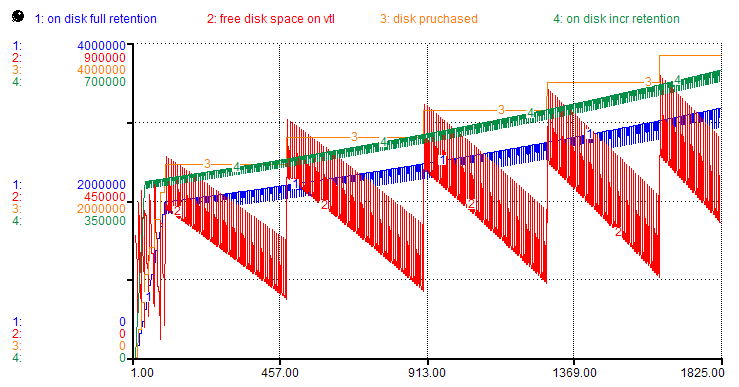
Even though we had a profound impact on the simulation of disk and tape consider the effects will be proportionately reflected to both backup target types. Number of tapes purchased: 7,000 at a cost of $350,000. Equivalent disk purchased at a cost of $11.55M. The cost difference is 33x more to use disk than tape. Additionally, even though you were able to reduce your TCO by reducing your retention levels, you may not be able to or want to change these retention levels because you are in a regulated industry. It's also possible that your company has requirements for an off-line backup to protect from rolling disasters, sabotage, time bombs, etc.The holy grail to being able to do disk based backup at a competitive cost to that of tape lies with deduplication or single-instance storage technologies. Single instance storage, sometimes referred to as SIS or deduplication 'a.k.a. dedupe' encompasses various methods of reducing storage needs by eliminating redundant data. Below is the graph of a simulation using our first configuration parameters with the only exception being we will be deduping data to our disk based storage device at an aggressive rate of 30:1.

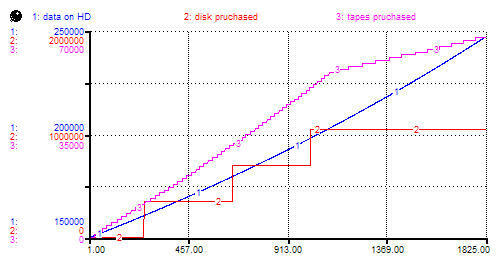
 We can see the differences above in the behavior of the media consumption with a dedupe factor of 30:1 which for the parameters of this model is the sweet spot where the costs of disk are on par with those of tape. See the graph to the right that shows the pattern of purchasing disk to that of tape and how much source data resides on disk with a 10% growth rate.
Here we spent $3.15M on disk, $250 less for disk than tape over the span of five years. However, it should be noted that this does not include the infrastructure costs for supporting the disk arrays in your data center. While the capacity of a disk frame is finite, the capacity of a tape library is infinite because you can easily remove the used media and replace it with brand new, scratch media. So, even at a dedupe rate of 30:1 tape is still overall, less expensive once you factor in your other, required costs.
Additionally, there are other things to consider about dedupe before running out and buying a dedupe device. First, at the time of this writing, there is no DR for dedupe devices. One of my requirements as a backup & storage architect is the ability to back up the deduped data in the deduped state and be able to restore it to a new dedupe device array when my primary one dies. And yes it will die, or suffer some form of corruption, or hash collision or error in the firmware, or operator error or something else we haven't mentioned yet. That is the whole idea of doing backup in the first place; protecting your data and being able to recover it in the event of a failure. Currently, the only way to get a copy of your data off a dedupe array is to re-inflate it and write it out in its original size. That means, if you have data that's deduped at 30:1, or roughly 2PB of data backed up and stored on a 70TB array, you'd have to write out all 2PB somewhere else, either to a 2PB array or 2PB of tape. Either way, having to have to re-inflate the data defeats to purpose of having a dedupe device in the first place. We want to be able to write the 2PB in its deduped state of 70TB as a backup copy which would only be 175 LTO-3 tapes at a cost of $8,700 in tape media that you could rotate off-site and keep a few copies doing weekly backups. If you don't backup your dedupe device and it dies, you are at risk of loosing EVERYTHING that you ever backed up to that device. This is not true of tape. Additionally, while I did say that I wouldn't address speed issues in this paper, it should be noted that restoring data from a dedupe devices is decidedly slower than either tape or disk thereby threatening your recovery time objective.
Don't get me wrong, I'm not a tape cheerleader and I'm not funded in any way by any 'tape consortium'. But when I design backup architectures and someone pays me to ensure that my backup system is the last line of defense against, computer errors, natural disasters, computer viruses, and very human people occasionally doing very stupid things, I cannot put all my eggs in one dedupe basket. My prediction is that in the next few years, dedupe appliances will become even more efficient, faster and have built in DR such that I can backup to tape, the dedupe device and have a reliable, final line of defense against any number of countless disasters that can and will occur such that the company that I designed that system for will still be in business following the disaster. That, after all is what business continuity and disaster recovery planning is all about.
※ ※ ※
Storage Forecaster™ Service
Save millions in storage costs by being able to forecast data storage growth.
